Study the following graph and answer the question based on the graph.
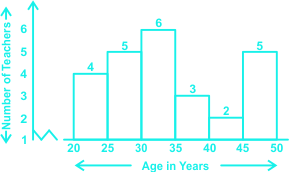
How many teachers are aged 45 years or more but less than 50 years?
Show answer & explanation
Correct answer: D
Explanation
The correct answer is Option 4 i.e 5.
| Understanding/Application |
| We need to study the graph carefully - |
| Number of teachers who are aged 45 years or more but less than 50 years i.e. 45 - 50 = 5 |