Study the following graph and answer the question that follows.
The following bar graph shows the percentage profit earned by two companies A and B over the given years.
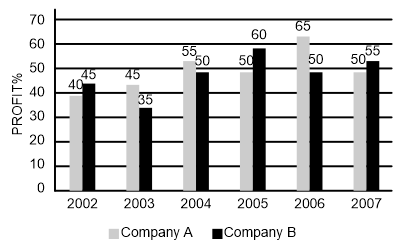
The incomes of two companies A and B in 2006 were in the ratio 3 : 4, respectively. What was the respective ratio of their expenditures in 2006?
Show answer & explanation
Correct answer: D
Explanation
The correct answer is option 4 i.e. 15 : 22.
Let the income of company A and B is 300x and 400x, respectively.
Expenditure of company A = Income/( 1 + profit% )
⇒ 300x/1.65
Expenditure of company B = Income/( 1 + profit% )
⇒ 400x/1.50
Required Ratio = (300x/1.65) : (400x/1.50)
⇒ 15 : 22