Study the following bar graph and answer the question given below.
The bar graph represents the total number of applications received for B.Sc. Mathematics by two different colleges A and B in 5 different years.
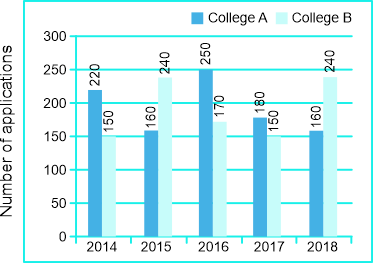
Find the difference between the average number of applications received by college A from 2014 to 2018 and the average number of applications received by college B from 2014 to 2018?
Show answer & explanation
Correct answer: A
Explanation
The correct answer is option 1 i.e. 4.
The average number of applications received by college A from 2014 to 2018 = (220 + 160 + 250 + 180 + 160)/5 = 194
The average number of applications received by college B from 2014 to 2018 = (150 + 240 + 170 + 150 + 240)/5 = 190
Difference = 194 - 190 = 4