Study the following bar graph and answer the question that follows.
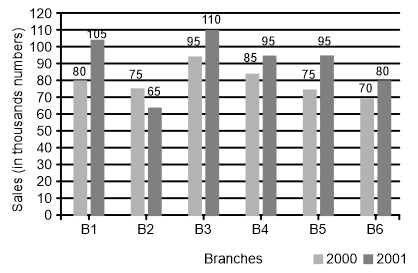
The total sales of books for branches B1 to B5 for the year 2000 are how much more than the average sales of books for branches B1 to B5 for the year 2001?
Show answer & explanation
Correct answer: D
Explanation
The correct answer is Option 4 i.e. 316.
The total sales of books for branches B1 to B5 for the year 2000 = 80 + 75 + 95 + 85 + 75 = 410
The total sales of books for branches B1 to B5 for the year 2001 = 105 + 65 + 110 + 95 + 95 = 470
Average sales in 2001 = 470/5 = 94
Difference = 410 - 94 = 316