Study the following bar chart, which represents the income and expenditure of a company.
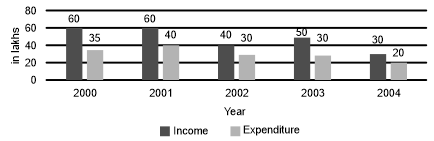
In how many years is the income of company less than the average income?
Show answer & explanation
Correct answer: C
Explanation
The correct answer is option 3 i.e. 2.
Average income = = 48
In 2002 and 2004 the income of company is less than the average income.