Study the bar graph and answer the question that follows.
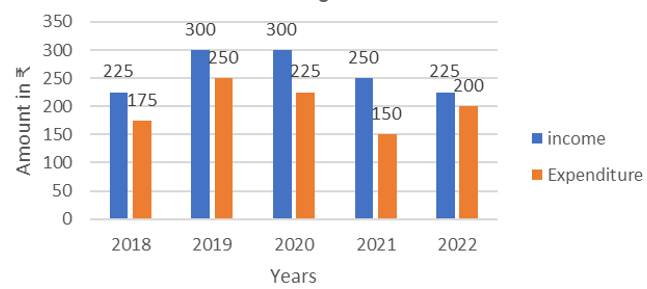
The bar graph shows the income and expenditure (in ₹ crores) of a company in 5 years from 2018 to 2022.
In which year is the ratio of income to expenditure 2nd highest?
Show answer & explanation
Correct answer: C
Explanation
The correct answer is Option 3 i.e. 2020.
The ratio of income to Expenditure:
2018 = 225/175 = 1.28
2019 = 300/250 = 1.2
2020 = 300/225 = 1.3
2021 = 250/150 = 1.67
2022 = 225/200 = 1.125
Second highest in 2020