Study the given graph and answer the questions that follows.
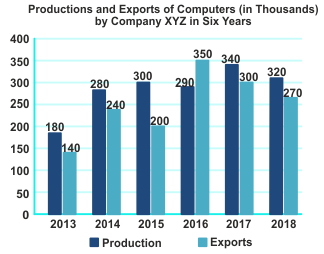
In which year was the production of computers of the company 16% more than the average exports of computers in the six years (2013 to 2018)?
Show answer & explanation
Correct answer: D
Explanation
The correct answer is option 4 i.e. 2016
Average export of computers in all six years = (140 + 240 + 200 + 350 + 300 + 270)/6 = 250.
16 % more than 250 = 250 × 116% = 290.
One can see that, in 2016 the production of computers is 290.