The given Bar Graph presents the number of students of two schools for six years.
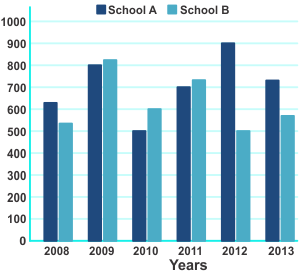
In which year, the percentage increase in students in school B is the highest in comparison to its previous year?
Show answer & explanation
Correct answer: A
Explanation
Correct Answer is option 1 i.e. 2009
|
Application |
Fair calculation |
|
The percentage increase in students in school B is the highest in comparison to its previous year in year 2009 = (820 – 550)/550 × 100 = 49.09 % |
(820 – 550)/550 × 100 = 2700/55 = 49.09 |