The given Bar Graph present the Imports and Exports of an item (in tonnes) manufactured by a company for the five financial years, 2013-2014 to 2017-2018
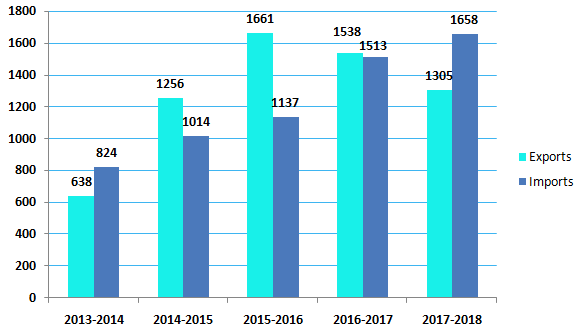
In which financial year the percentage increase in Imports is the highest in comparison to its previous financial year?
Show answer & explanation
Correct answer: D
Explanation
The correct answer is option 4 i.e. 2016 – 2017
|
Application |
|
Total imports in 2013-2014 = 824 Total imports in 2014-2015 = 1014 Increase = 1014 – 824 = 190 Percentage increase = (190/824) x 100 = 23.05% Total imports in 2014-2015 = 1014 Total imports in 2015-2016 = 1137 Increase = 1137 – 1014 = 123 Percentage increase = (123/1014) x 100 = 12.13% Total imports in 2015-2016 = 1137 Total imports in 2016-2017 = 1513 Increase = 1513 – 1137 = 376 Percentage increase = (376/1137) x 100 = 33.06% Total imports in 2016-2017 = 1513 Total imports in 2017-2018 = 1658 Increase = 1658 – 1513 = 145 Percentage increase = (145/1513) x 100 = 9.58% Hence, the percentage increase in Imports is the highest in financial year 2016-2017comparison to its previous years. |