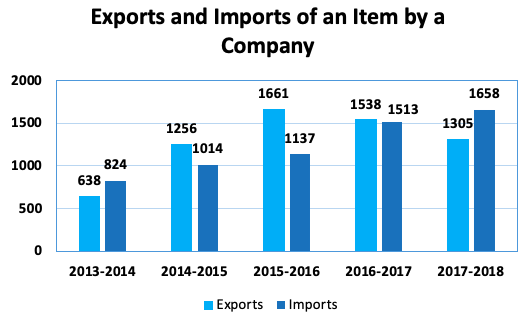
The given Bar graph presents the imports and exports of an item (in tonnes) manufactured by a company for the five financial years, 2013-2014 to 2017-2018.
In which financial year the percentage increase in imports and exports taken together is the highest in comparison to its previous financial year?
Show answer & explanation
Correct answer: C
Explanation
Correct Answer is option 3 i.e. 2014 – 2015
|
Concept |
Understanding |
Application |
|
Average and Percentage |
Extract the data from the bar graph
|
Import + Export: During 2013-14: 824 + 638 = 1462 During 2014-15: 1256 + 1014 = 2270 During 2015-16: 1661 + 1137 = 2798 During 2016-17: 1538 + 1513 = 3051 During 2017-18: 1658 + 1305 = 2963 Percentage change in 2 consecutive years: During 2014-15: [(2270 – 1462)/1462] × 100 = 80800/1462 = 55.27% During 2015-16: [(2798 – 2270)/2270] × 100 = 52800/2270 = 23.26% During 2016-17: [(3051 – 2798)/2798] × 100 = 25300/2798 = 9.04% During 2017-18: [(3051 – 2963)/3051] × 100 = 9800/3051 = 2.89% (drop) Hence, it is highest in 2014 – 2015. |