In the given bar graph, the white bar shows the income and the blue bar shows the expenditure of a company. Study the graph and answer the question that follows.
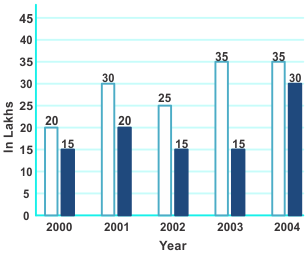
The expenditure from 2001 to 2002 decrease by:
Show answer & explanation
Correct answer: C
Explanation
The correct answer is Option 3 i.e  .
| Understanding/Application |
|
Expenditure in 2001 = 20 lakh Expenditure in 2002 = 15 lakh |
|
Percentage decrease = [(2000000 - 1500000) × 100]/1500000 = (50000000/1500000) = |