In the given bar graph, the white bar shows the income and the blue bar shows the expenditure of a company. Study the graph and answer the question that follows.
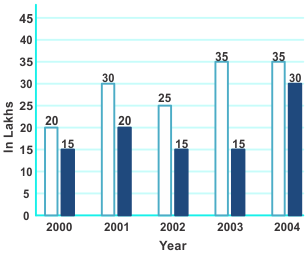
The income in 2001 was equal to the expenditure in the year.
Show answer & explanation
Correct answer: D
Explanation
The correct answer is Option 4 i.e 2004.
| Understanding/Application |
|
Income in 2001 = 30,00,000 Expenditure in 2000 = 15,00,000 Expenditure in 2001 = 20,00,000 Expenditure in 2002 = 15,00,000 Expenditure in 2003 = 15,00,000 Expenditure in 2004 = 30,00,000 |
| Income in 2001 = Expenditure in 2004 |