Study the bar graph and answer the question.
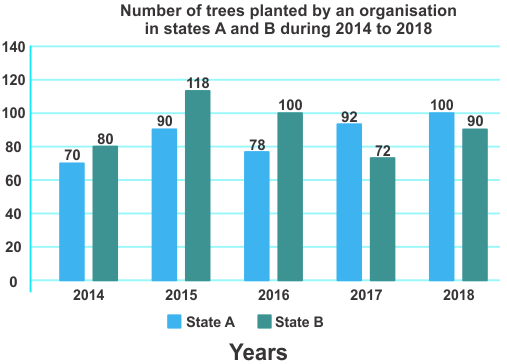
In how many years was the number of trees planted in state B more than the average number of trees planted in state A over the years?
Show answer & explanation
Correct answer: B
Explanation
The correct answer is Option 2 i.e. 3
| Understandding | Application |
| Tricks |
Sum of A over years = 70 + 90 + 78 + 92 + 100 = 430 Average = 430/5 = 86 |
| Now |
In B which is more than from the average of the A = 2015 2016 and 2018 |