Directions: The bar graph shows the production of bikes by a company (in thousands) over the years.
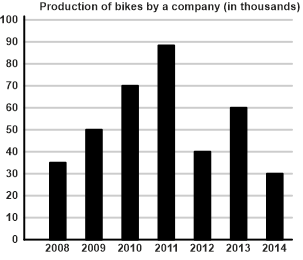
In how many of the given years was the production of bikes more than the average production of bikes over the years?
Show answer & explanation
Correct answer: C
Explanation
The correct answer is Option 3 i.e. 3 years.
Average = Sum of observations/Number of observations
The average production of bikes over all the years
Average = (35 + 50 + 70 + 90 + 40 + 60 + 30)/7
⇒ 375/7 = 53.57
Thus, from the given graph we can easily conclude that in 2010, 2011, and 2013 the production of bikes is more than the average production