Directions: The following graph shows the production (in thousands) of two types (A and B) of cars by a company over the years 2016 to 2021.
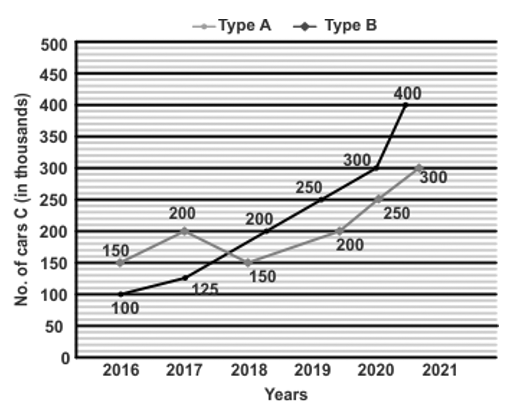
In how many of the given years was the production of type A cars more than the average production of this type of car in the given years?
Show answer & explanation
Correct answer: A
Explanation
The correct answer is Option 1 i.e. 2.
Given that,
The production of type A cars in 2016, 2017, 2018, 2019, 2020, 2021 = 150, 200, 150, 200, 250, and 300
We know that,
Average = Sum of observations/Number of observations
The average = (150 + 200 + 150 + 200 + 250 + 300)/6
⇒ 1250/6 = 208.33
Hence,
From the given chart there are 2 cars of type A whose production is more than the average production of type A cars.