Bar graph shows the number of students enrolled for a vocational course in institutes A and B during 5 years from 2014 to 2018.
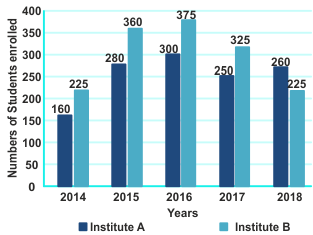
The total number of students enrolled in institute B during 2014, 2016 and 2018 is what percent of the total number of students enrolled in institute A during the five Years?
Show answer & explanation
Correct answer: A
Explanation
The correct answer is Option 1 i.e 66%.
The total number of students enrolled in institute B during 2014, 2016 and 2018 = 825
The total number of students enrolled in institute A during the five years = 1240
Required % = (825/1240) × 100 = 66%