Bar Graph showing the number of cars sold by a reputed company during different months of the year. Look at the following bar graph and answer the question that follows:
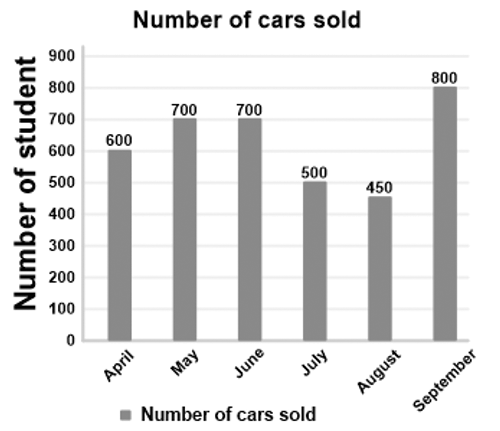
In which month was the sale highest and was what percent of the total sale of 6 months?
Show answer & explanation
Correct answer: A
Explanation
The correct answer is option 1 i.e. September 21.3% nearly.
The total sale of 6 months = 600 + 700 + 700 + 500 + 450 + 800 = 3750
Highest sell (September) = 800
Required percentage = Highest sell/Total sell in 6 months × 100
= 800/3750 × 100
= 21.33%