Directions: Study the given histogram and answer the questions that follow.
The histogram shows the distribution of marks obtained by 115 students in a college.
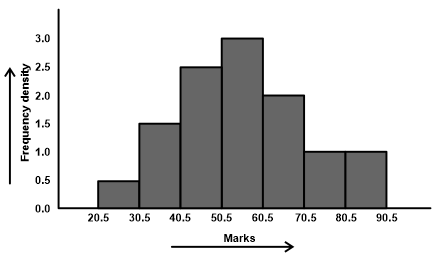
A student is marked as qualified if he/she obtains marks above 40.5. Here, the ratio of the number of qualified students to that of students who are not qualified is:
Show answer & explanation
Correct answer: C
Explanation
The correct answer is Option 3 i.e. 19 : 4.
We know that,
Frequency = Frequancy density × width of the bar
From the given graph
Number of qualified students(Marks > 40.5)
From(40.5 to 50.5):
Frequency = 2.5 × 10 = 25
From(50.5 to 60.5):
Frequency = 3.0 × 10 = 30
From(60.5 to 70.5):
Frequency = 2.0 × 10 = 20
From(70.5 to 80.5):
Frequency = 1.0 × 10 = 10
From(80.5 to 90.5):
Frequency = 1.0 × 10 = 10
So, total number of qualified students = 25 + 30 + 20 + 10 + 10 = 95
Number of non-qualified students(Marks ≤ 40.5)
From(20.5 to 30.5):
Frequency = 0.5 × 10 = 5
From(30.5 to 40.5):
Frequency = 1.5 × 10 = 15
So, total number of non-qualified students = 5 + 15 = 20
Thus,
Required ratio = Number of qualified students/Number of non-qualified students
⇒ 95/20 = 19/4 = 19 : 4